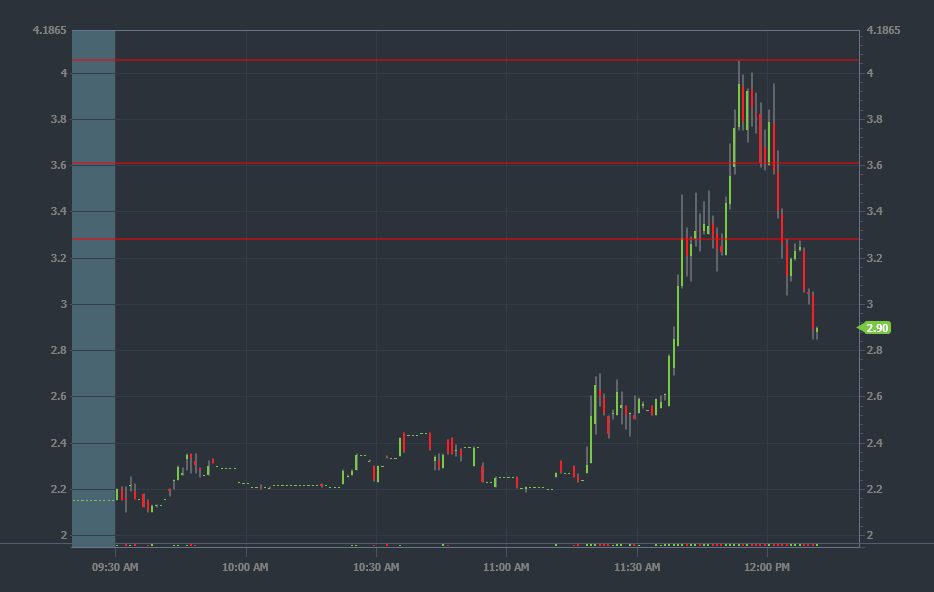
Check out this chart of Acalrion Inc (ACON).
I had these areas identified before the stock started its run.
Where did they come from???
Am I a magician?
Probably.
But this didn’t require any special training, just some inside knowledge I’m going to drop on you today.
Folks that completed my Challenge Program saw my alerts come across their desk for an entry at 11:45 a.m. EST.
I started picking up shares around $3.32, on top of the lowest price level on the chart.
In less than 10 minutes, I managed to exit the middle price level on the chart.
And wouldn’t you know it, the stock topped out at the third price level.
So just how did I come up with these lines?
It’s easier than you think.
Look for Swing Points
As fast as stocks rise, they can plummet.
Similarly, when they plunge, you can find some epic bounces.
When this happens it creates swing points.
We find these all the time in charts across different time frames.
Let’s take a look at the chart for ACON going back several days.
In one of the most active premarket sessions on April 25, shares of ACON spiked to hit a high of $4.01.
Then, they dropped down before spiking again to $3.61.
Finally, they made one last spike in the regular session to $3.27.
Guess what my entry into ACON was?
$3.32.
And my exit?
$3.64.
And where did the stock top out yesterday?
$4.05.
Now I’m going to let you in on a little secret.
Most traders ignore the premarket session. They focus entirely on the regular market.
That’s fine for big-cap stocks.
But for penny stocks, and especially ones that trade heavy volumes outside of regular hours, premarket analysis is a must.
Now, I will admit that learning how to identify the correct swing points can take some practice.
To do this, simply pull up charts that already ran or have begun to drop. Then trace back to the appropriate swing points.
Once you get good, start marking levels on your chart as a stock starts to take off or drop and see how you do.
Is it Support or Resistance?
Let’s go back to the first chart I posted.
I want you to notice a few things.
First, check out how the middle line didn’t provide much resistance on the way up. But, it did provide support on the way down.
Support and resistance lines aren’t absolute. They’re areas of high probability where price is likely to see a pause in its trend.
Similarly, the bottom level acted as support and resistance on the way up. On the way down, it only acted as resistance once the stock retraced after slicing through that price.
And we can see that the top line acted as resistance by stopping a serious run dead in its tracks.
Now, you’ve probably heard the saying what was once support becomes resistance and visa versa.
This is absolutely true.
Take that upper $4 line for example.
Pretend the stock had managed to bust through and get to $4.50.
If it spent any amount of time there and then retraced, there’s a good chance $4.00 would have acted as support.
You see, by taking out that price and holding over it for a period of time, you get short-sellers caught on the wrong side of the trade that suddenly gets squeezed, sending prices even higher.
In fact, this concept is one of the keys to trading guru Tim Bohen’s favorite chart patterns.
He frames many of his trades using a break of recent highs as a catalyst for long plays.
Swing points tell us a story. To read them, you need to look at their context.
Have these swing points been tested before?
Are they at new highs or lows?
Was there a lot of volume when these swing points formed?
Each of these pieces of information can help you analyze and decide what is likely to happen.
Final Thoughts
Can you use Fibonacci or other systems like Oracle on our StocksToTrade Platform?
Absolutely.
In fact, I would encourage you to leverage several. That way, when they come up with the same price levels, you can have more confidence they’ll act as support and resistance.
Just don’t use so many indicators that you lose focus on what you’re trying to achieve.
Keep it simple and keep it robust.
— Tim
The post Crazy Price Levels With $ACON appeared first on Timothy Sykes.


