Hey trader. Tim here.
With the market in an apparent downtrend, you might think I’d be spending most of my time looking for opportunities to short…
But the truth is … I very rarely make bearish trades.
I know that surprises a lot of folks.
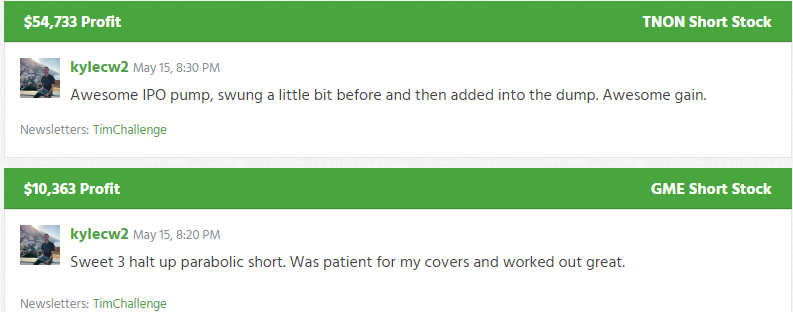
Some of my top students trade almost exclusively to the short side, like Kyle Williams…
Not bad to finish out the week up more than $68,000
You might be thinking…
‘Tim, don’t you primarily trade penny stocks? And aren’t most penny stocks just junky companies with no actual product, service, or revenue?’
It’s true … And it’s one of the main reasons I LOVED shorting penny stocks for a large portion of my career.
However, market dynamics have changed. And even in a bear market, the strategy only makes sense for a few people.
If you’re trading a small account and trying to build your stack … then I have an even better strategy than shorting stocks in this market…
And if you can identify these two things they can be total game-changers for you…
Learn About Floats
© Millionaire Media, LLC
Anytime a stock goes public, the company sets a specific number of shares that can trade on the exchange.
This is known as the float.
Floats can change if a company sells (tenders) more shares or buys them back.
By themselves, floats don’t matter much. They only matter relative to the volume that trades.
As you might imagine, low-float stocks often trade relatively few shares.
So, what do you think happens when news drives a bunch of traders to a low-float stock?
You get a squeeze.
It doesn’t matter whether someone has sold shares short or not. When you get heavy volume on a low-float stock, it usually sends prices higher.
Think about it like this.
If I owned a few shares of Stock XYZ that suddenly jumped 125%, I might sell one or two. But I’d likely hold out to see if I can sell the rest at a higher price.
If enough traders do the same thing, you’ll see the share price skyrocket.
Does it matter how many shares are sold short?
Of course.
When short-sellers — those who bet against a stock by borrowing from their broker — get caught in a squeeze, brokers will issue margin calls. That forces the short-seller to buy back the stock to close their position, which adds more fuel to the buy-side.
But here’s the thing…
The reports on short floats don’t get updated all that often.
And with stocks moving as much as triple-digit % intraday, they’re practically worthless.
That’s why I’m more interested in the total available float of a stock.
What would I consider a low-float stock? One with less than 10 million shares available for trading.
You can use filters on screeners like the one on our StocksToTrade platform.
Here, I can filter for a stock’s float, price, volume, and a host of other factors that save me time.
Watch Out for Breakouts
Take a look at the following chart of Sysorex Inc. (OTCPK: SYSX).
I circled various highs in the chart over the last several days.
Imagine you shorted this stock. Where would you have put your stop?
The recent highs would be a good place to start.
Every time a recent high is broken, there’s a solid chance you’ll see short traders covering their positions.
You see the same thing when long traders get stopped out.
So, how do we know when it’s likely to cause a short squeeze?
That’s when I look for the highest of the highs.
The longer a high has held, the more likely it is to act as a catalyst for a short squeeze.
Using SYSX, let’s zoom out to the daily chart.
See how the price made a high after a ton of trading volume hit the stock?
I can almost sense that short traders have their stops set at the highs.
Given that it’s been more than a week since SYSX made those highs, if it breaks them, it’s very likely to cause a short squeeze.
Now, that may not happen all at once if it just pokes above that price for a minute or two.
But when I see multiple candles close above that price, it indicates that buyers are stepping in and forcing shorts out of their positions.
Study This Chart
There’s no better setup to see how this concept works than my Supernova pattern.
I love this chart because it has all the lifecycle events for a stock.
And it’s also the pattern I used to help me make my first million.
Click here to learn more about my Supernova Pattern.
—Tim
The post I Stopped Shorting Stocks appeared first on Timothy Sykes.


