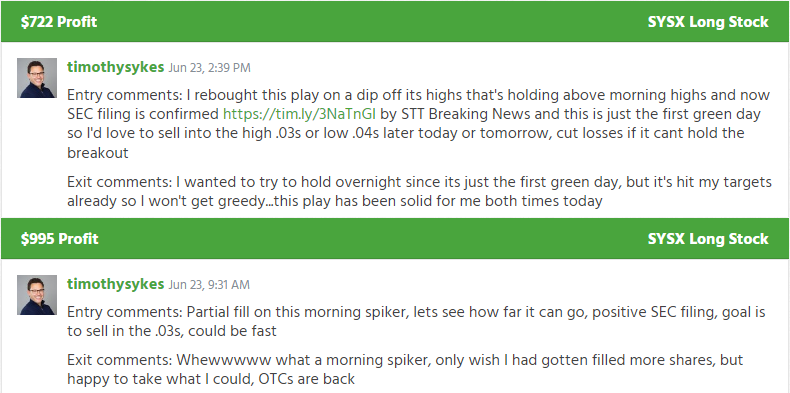
Everyone loves a great deal. But nothing’s better than getting 2 for 1.
It’s like finding a $100 bill in your pocket that you forgot was there.
One of the lessons I teach my students is how to look for multiple trades in the same stock.
In fact, many of my daily watchlists hold the same stocks for weeks.
Sysorex Inc (OTC: SYSX) illustrates exactly why.
I had my eye on this tiny OTC stock for weeks now, trading it here and there.
But last Thursday, I hit two HUGE WINS on the same day.
What’s cool about these trades is I took both of them on the same stock on the same day.
And I used similar setups.
I want to show you both so you can learn to identify these same patterns on your own and capture even more opportunities.
Sysorex Inc (OTC: SYSX)
© Millionaire Media, LLC
After the market closed on Wednesday, news hit that Sysorex filed an 8-K update form with the SEC.
In the form, management stated they agreed to sell 75% of the company’s Ethereum mining assets and certain associated property to Ostendo for $68,400,000 of preferred stock.
As I’ve talked about in the past, not all news is created equal.
This is actually very positive news for SYSX.
What was unusual was that the stock didn’t see any premarket volume.
That led me to conclude that many traders missed the news. This presented an opportunity for a morning panic dip buy if we got a selloff.
Sure enough, shares opened up higher and provided a quick pullback I took advantage of.
The one-minute chart doesn’t even do this trade justice because it happened very quickly.
Shares ran from around $0.022 up to $0.028 in the first half minute.
They then sold off quickly on an increase in volume back to $0.026 where I got a partial fill.
All of this happened in roughly 40 seconds.
I used that small pullback as my entry to ride the stock up for another couple of minutes.
While I typically like to see a larger selloff, the lack of premarket action indicated to me that buyers were waiting for the open, so any selloff would likely be fast.
Now, this was enough to give me a healthy profit, even with a partial fill.
But as the day progressed, shares held their gains and began to slide upward.
I used that momentum to create a trade on a slight pullback.
This type of setup is something that you can use on any chart on any timeframe.
It’s a simple matter of looking for a stock in an uptrend, buying a pullback into a support level, and then selling into the next leg higher.
The keys to making it work are:
Entering the trade as close to risk (stop) as possible
Letting price action dictate when you enter the trade
Using that same price action to exit the trade
A lot of new traders can find support levels with relative ease.
Where many struggle is that second tier of analysis.
You see, when a stock hits a support level in an uptrend, the tendency is for that trend to resume. That’s doubly true for a stock with positive news and later in the day.
Additionally, the chart shows that all the volume that came in over the last several hours would push the stock higher.
That’s a clear indication that buyers are the ones in control.
Now, if the stock had simply stalled out after I bought it, I would’ve considered cutting the position quickly.
However, not only did it hold the line, but in the next few minutes, a small increase in volume pushed the stock’s price up briefly. That told me buyers were still coming into the stock.
Then, as the volume really picked up into the last hour of the trading day, I used that strength to exit the position for a nice profit.
The Bottom Line
© Millionaire Media, LLC
Any stock with enough momentum and positive news can create multiple trades, not just in one day, but over weeks.
In fact, this is a big part of the Supernova Pattern … the same pattern that helped me earn my first $1 million trading.
Learn more about this pattern and how it can help you find consistency in the market.
Click here to get started.
—Tim
The post One Stock – Two Wins – Different Times of Day appeared first on Timothy Sykes.


