Jai Kedia
Two weeks ago, some of the biggest names in academia and monetary policy gathered at Brookings to discuss what factors had contributed to the recent spike in inflation. To that end, Ben Bernanke and Olivier Blanchard designed a model and found that the primary causes for post‐Covid inflation were supply shortages, food price shocks, and energy price shocks – the “series of unfortunate events” explanation. However, their paper raises a larger issue with academic approaches to addressing real‐world economic questions.
The model used in the paper is niche, designed specifically for their analysis. Consequently, it is hard to analyze how much of the results are driven by real effects or by an unusual choice of model. One particularly strange choice is that the model does not include a direct avenue for policy, meaning that the other channels in the paper may be spuriously picking up monetary or fiscal policy effects (and even demand factors). The result is that it is impossible to determine where inflationary effects are truly coming from.
In a discussion of the paper, Jason Furman pointed out as much, showing that most of the shocks in the paper are endogenously determined. Using an empirical and a narrative approach, Furman attributes the sharp increase in core PCE inflation to reckless policymaking – the “original sin” explanation. The two analyses offer contrasting results but neither approach uses a unified theory that allows for the simultaneous comparison of several competing causes. This problem begs the question – why not use a benchmark model that generally captures the underlying features of the U.S. economy?
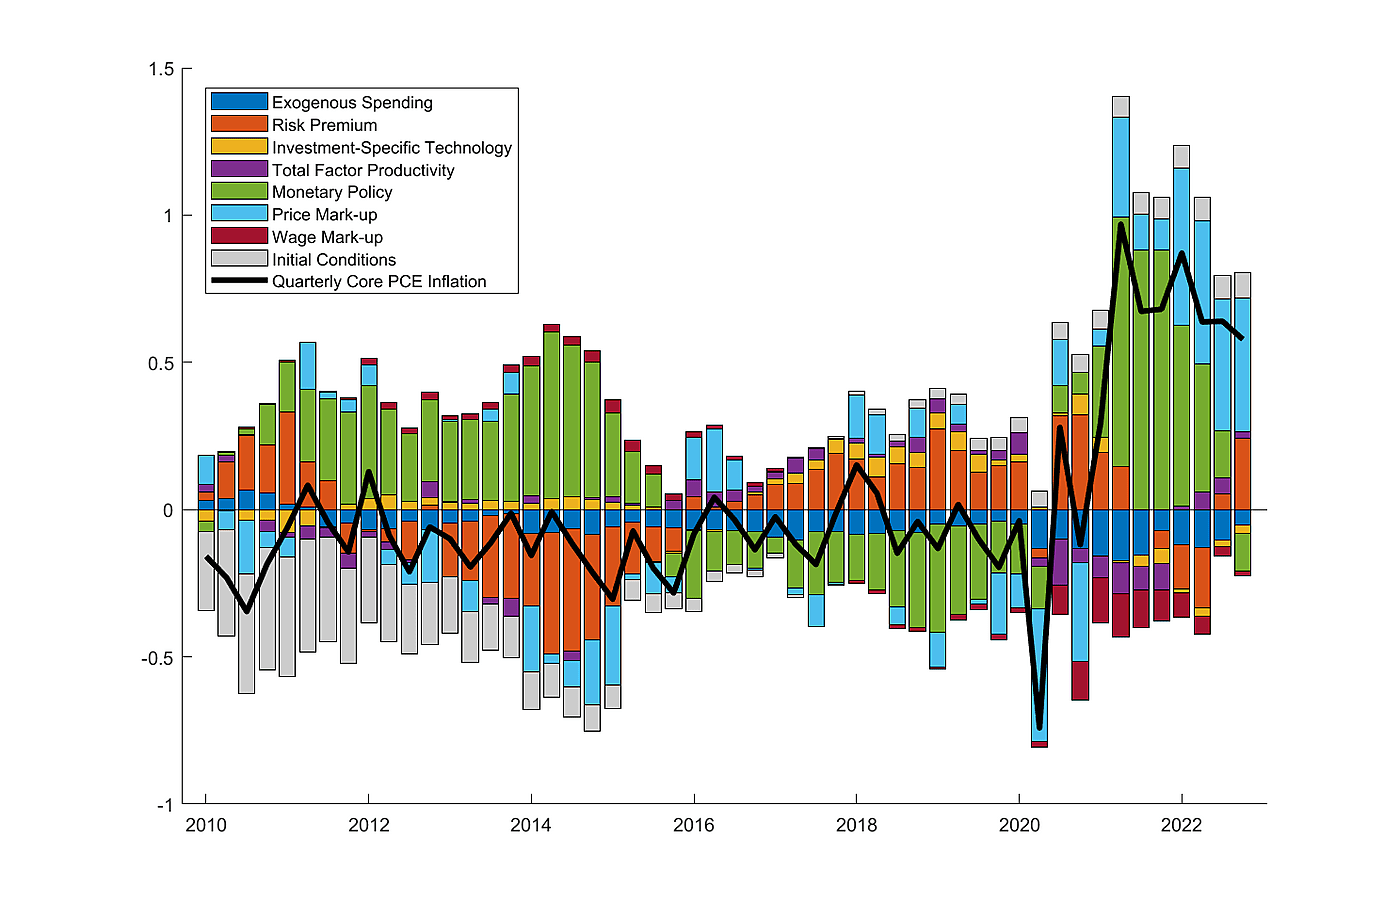
Figure 1 repeats the shock decomposition for inflation from the Bernanke and Blanchard paper with a standard monetary macro model – Smets and Wouters (2007). The model is a benchmark tool for macroeconomists and the paper itself has been cited over 6,000 times. This model includes seven different sources of variation that encompass a broad range of demand, supply, and policy factors, allowing for a robust extraction of the underlying causes of inflation. The results from this approach represent a more comprehensive version of figure 12 from the Bernanke‐Blanchard paper.
In Figure 1, quarterly core PCE inflation (the Fed’s preferred inflation metric) is broken down into its constituent sources from 2010 through 2022. The graph shows that neither explanation – unfortunate events nor original sin – is solely correct; both channels are at work. As is clear from the graph, inflation starts to spike in 2021 and remains high through the end of 2022. The two primary causes for elevated prices during this period are price mark‐ups (supply constraints) and monetary policy, with risk premium shocks (reflecting consumer demand preferences) playing a small role.
This finding corroborates the public consensus around inflation. The U.S. economy suffered drastic supply shortages in goods and services post‐Covid, which is reflected in strong price mark‐ups. Additionally, as my new Cato working paper documents, Fed policy was unusually poor during this period and significantly departed from the rules‐based governance that had worked well for the Fed in the past. The conclusion: both unfortunate events and original sin caused inflation.
These results are hardly surprising. Historic economic events – inflation is at a 40‐year high – usually have several underlying causes. Economists should refrain from fixating on dogmatic explanations or specialized models and instead return to tried and tested empirical methods that allow for a benchmark comparison of several possible factors.
The author thanks Jerome Famularo for providing research assistance during the preparation of this essay. All data used in this analysis was collected from the FRED website with the exception of the shadow interest rate. The Wu and Xia (2016) shadow rate was used as a proxy for the federal funds rate during periods when the Fed was constrained by the zero lower bound.


