Hey Trader. Tim Here.
You’d think in a market as nasty and volatile as the one we have right now, my students wouldn’t be struggling with this…
But they are…
You see, while most of Wall Street is trying to figure out where the bottom is on big-name companies…
My students and I are focused on a completely different set of stocks.
I’m talking about stocks that are breaking out to the upside in a wicked bear market.
Believe it or not … there are tons of them.
The challenge is identifying which are breakouts and which are fake-outs.
For my money, there is one tell above them all — volume.
And I have a simple solution to help you identify this correctly.
I want you to be able to look at a chart, like Better Therapeutics Inc. (NASDAQ: BTTX)…
…And figure out where the true breakouts are.
Here’s how it’s done.
Reading the Tape
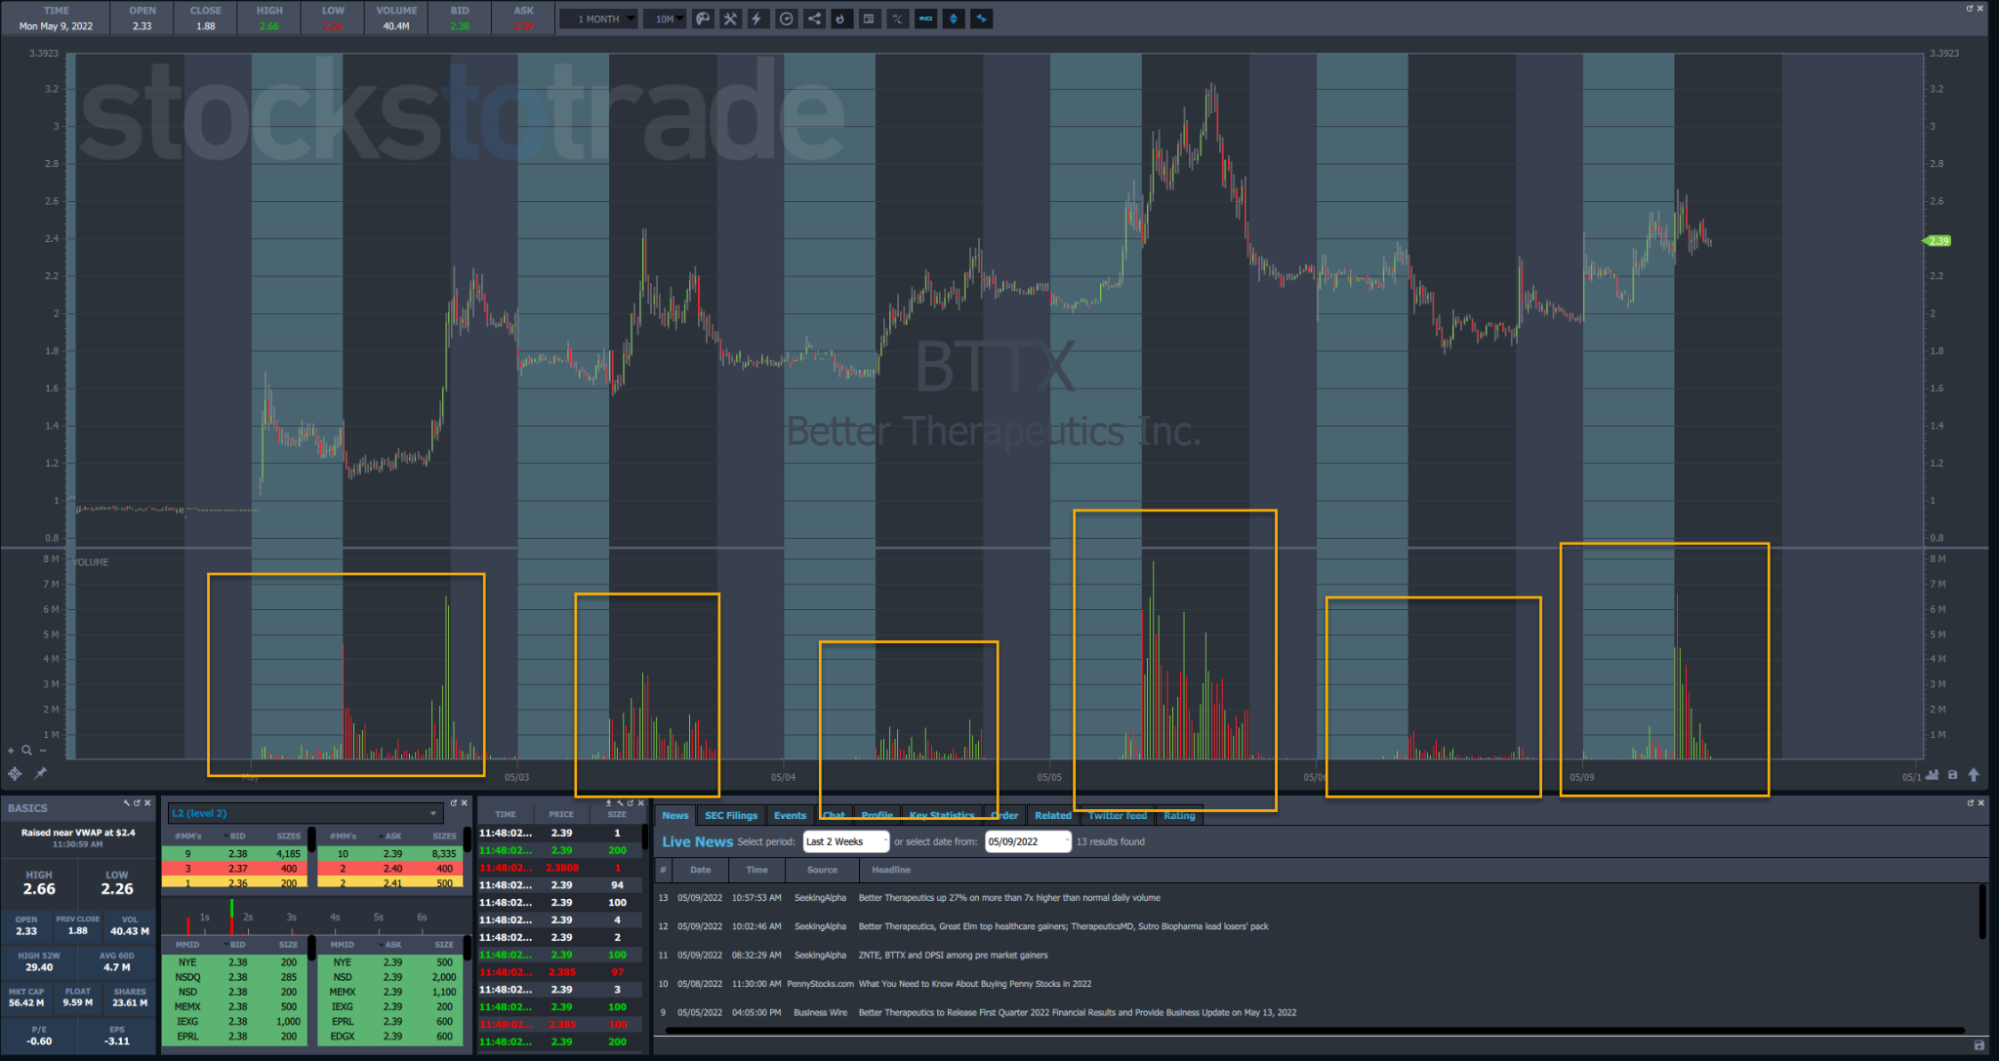
Take a look at the following chart of BTTX:
You’ll see two arrows that point to spots where the share price broke the previous high.
In the first one, shares pushed above the premarket high and closed nicely above.
In the second, shares spiked above the highs from the prior day but fell back shortly thereafter.
Just looking at these two examples, the difference is painfully obvious. The higher trading volume (at the first arrow) was almost 2x the lower trading volume (at the second arrow).
Surely, that explains why the first breakout survived while the other died.
Now, let’s take this a step further and expand our view…
I selected three breakouts on the same day. The first two breakouts moved higher, while the third failed.
At the bottom, you can see that the trading volume spiked for each breakout.
So … what’s different here?
Take a closer look at the volumes for the three breakouts:
In each of the breakouts, the trading volume spike was lower than the last one.
This simple concept is your most powerful volume analysis tool. It can be summarized as follows:
When volume decreases as a stock makes new highs (or new lows for that matter), each subsequent breakout loses its strength.
Simple enough, right?
My Biggest Pitfall
If this concept is so easy to grasp, why do traders struggle to use it correctly?
It comes down to how we trade.
Let’s go back to that first breakout that reached (and stayed above) the premarket high:
Practically speaking, if you had waited for a candle close to confirm your trade — you would’ve missed the boat.
That’s the nature of the beast.
But is there a way to forecast when this might happen?
Yes, there is.
My friend/former student Tim Bohen teaches his StocksToTrade Advisory group about a concept known as VWAP hold.
Essentially, he watches to see if a breakout stock, like BTTX, holds VWAP into the late afternoon.
I like using this method as a simple way to help traders identify a stock that’s run hard, yet still retains strength.
From there, you can look for a pattern, like so:
See how the volume rose relative to the last few hours, creating a bullish move into a small consolidation?
That last candle before the massive breakout actually closed above the high of the regular trading session.
We can use that as a signal that the stock wants to run into the close. But again, it all depends on the context.
If I saw this same thing at noon, I might not be as thrilled. The same would apply if I saw this happen after whippy price action.
Specifically, this works because:
Volume increases
That volume occurs with a bullish move, relative to consolidation
Share price closes candles above the high of the day
This occurred into the close
Using this framework, you can look for a run above the premarket high (or more), with a stop at (or below) the low of the day.
Most traders look at all spikes in volume and breakouts the same. But they’re not.
You have to view them in context. That means looking at:
Time of day
Whether shares have broken the high or low of the day so far (and how they did it)
Volume (and volume trend) up to that point, relative to the day
Now, compare the chart above chart with the second breakout noted in the chart below:
This setup doesn’t look as good because:
Volume didn’t increase that much before the breakout
Shares were already over the high of the day
This occurred towards the late morning (when volume tends to die out)
When in doubt, look for obvious signals rather than subtle ones.
If you have to think too hard about it, it’s probably not worth it.
Final Thoughts
These concepts take time and practice.
But you don’t have to do it alone…
That’s why I want you in my Trading Challenge.
Over the years, I’ve taught thousands of students to trade the markets and develop their own unique styles.
And now, I want to help you.
Click here to join my Trading Challenge.
—Tim
The post Every Breakout Needs This Confirmation appeared first on Timothy Sykes.